
Export destinations (2023)


Home > For Buyers > Market Insights > Tomato Preserves & Sauces Insights
Italy is the world’s leading exporter of tomato-based products
Growth Segments in Italy (2023)
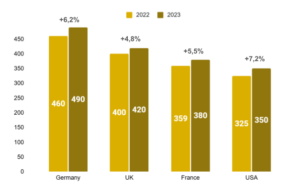
Export destinations (2023)
Source: ISTAT, 2024
Premium tomato preserves grew +15.2% YoY, with DOP San Marzano and cherry tomatoes leading the growth, commanding a 65% price premium in export markets
Organic and ‘free-from’ products represent 32% of category value, growing at +28% YoY, with transparency in sourcing driving consumer preference
Premium ready-made sauces grew +12.4%, with regional recipes and clean ingredients capturing 45% of new product launches
Italy processes 5.2 million tons of tomatoes annually. The Southern varieties, including San Marzano DOP, command the highest premium globally, with prices up to 4 times higher than standard preserves.